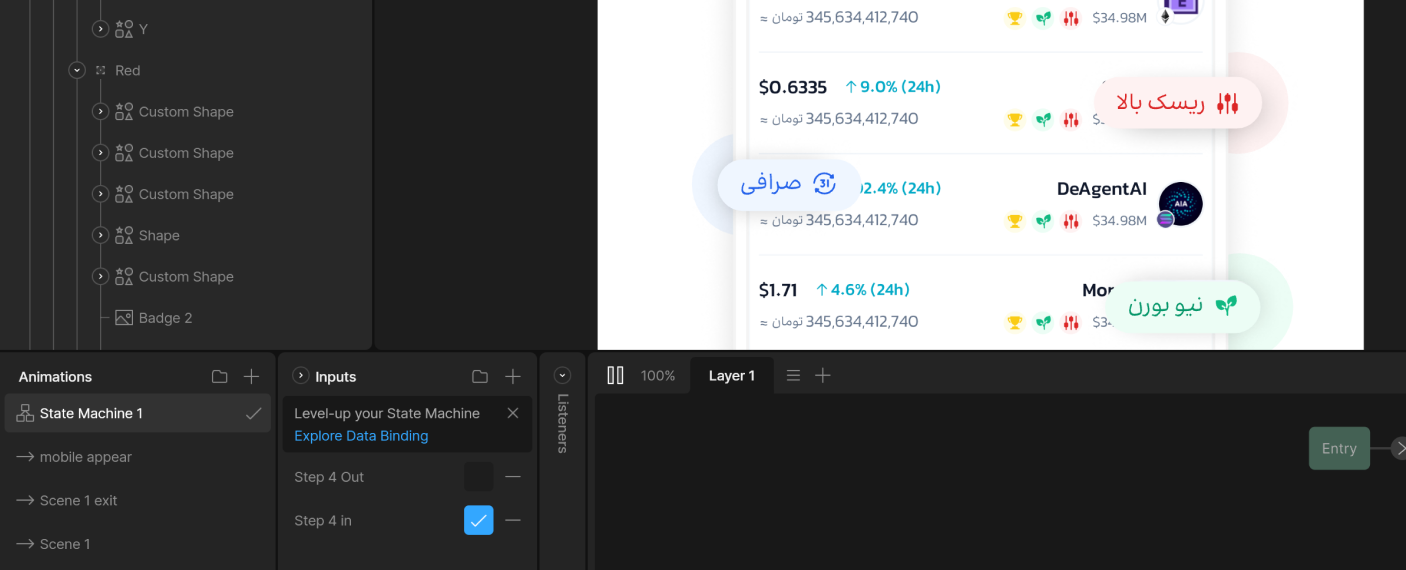
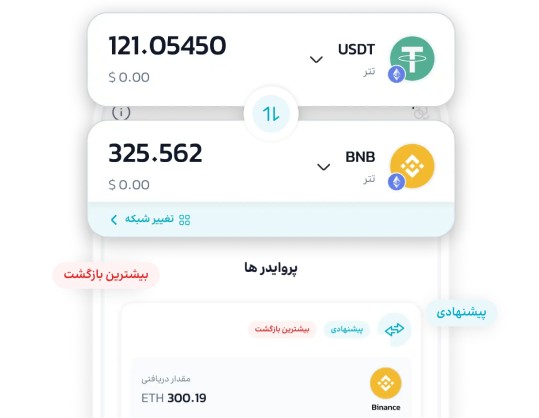
This project centered on delivering a high-impact, real-time data visualization experience for a cryptocurrency platform’s key performance metrics. Our focus was on translating complex financial data (market cap, volume, top performers) into a clean, scannable, and engaging UI that emphasizes market opportunities and risk assessment.
Client Brief:
The core objective was to create an interactive, live motion design element specifically an interface prototype for a critical section of their website. This animation had to be fully dynamic, convey sophisticated data clearly, and, critically, meet severe performance constraints: a final file size under 200 KB while maintaining full Lottie motion interactivity. The project also operated under an extremely short deadline.
Project Breakdown:
-
Interface Design: Minimalist wireframe and visual design of the crypto terminal view.
-
Asset Generation: Export optimized vector assets for Rive/Lottie.
-
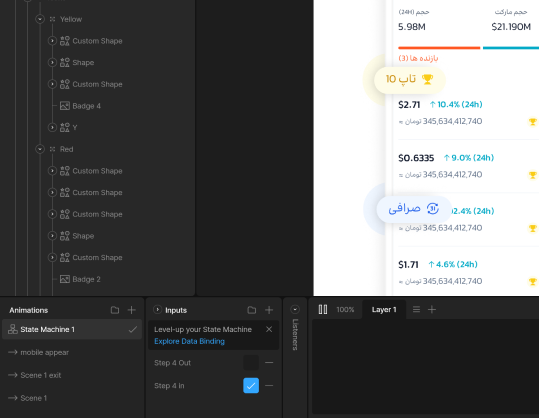
State Machine Development: Building interactive logic and data binding placeholders.
-
Optimization Loop: Relentless testing and refinement to meet the strict 200 KB size limit.
-
Final Delivery: Export of the highly optimized, interactive motion asset.
Technology Used:
Rive/Lottie (Advanced State Machine logic and animation engine), Figma (UI/UX design and asset preparation), Data Binding Methodologies (for interactive web integration).